
Recursive, Nuts & Bolts Part 3 - Rendering the Results (3 of 3)
This is part two of my three part series on the internals of Recursive, an extension for Chrome. In the first post I talked about the general structure of Recursive and some of the lessons I learnt from dealing with Typescript. In the second post I discussed how Recursive goes about crawling and parsing the web. In this, the final post, i'm going to talk about how Recursive represents, lays out and renders that crawled data on the screen.
Code Structure
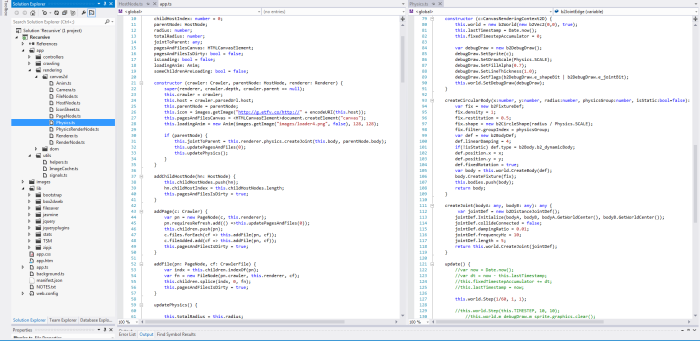
As mentioned in the first post in the series I have tried to keep the rendering logic as separate as possible from the actual crawling logic. This separation between the renderer and the crawler makes things simpler to understand in the code. The crawler is a model and the renderer is the view. The renderer simply displays whatever state the model contains.
Representation
The question how to represent all the masses of data that the crawling process generates was tricky to decide upon and took quite a bit of tinkering before it ended up in its current form. I first toyed with the idea of displaying the data as a simple list of links where each list represents the next depth in the recurse, I demonstrated this concept in an early video:
The problem, as can be seen in the above, is that there is still far too much data to display in that manner. I also wanted something that was more immediately visual, something that lets you see relative importance of nodes in the graph at a glance, simple lists of links couldn't provide this.
I remembered when I first launched Chrome Crawler a while back someone sent a video in which they had cleverly used Chrome Crawler and the open-source graphing program Gephi to great effect:
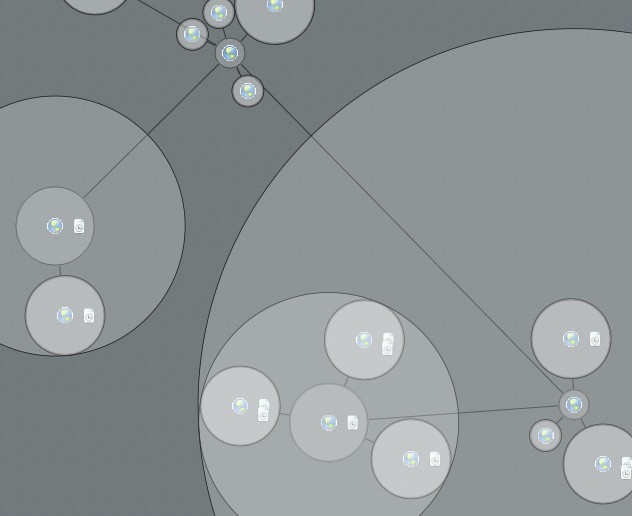
When thinking about the problem of how to represent the data I was aware that a key difficulty was representing the relative importance of nodes and edges in the crawl graph but not to swamp the user with too much information. I eventually decided that grouping pages and files together under the domains that the crawler found them would be a good way of giving a sense of the relative size of each domain and the number and type of files found there.
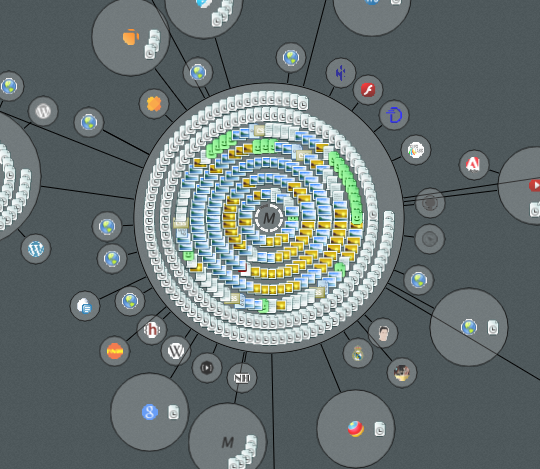
Nodes, I decided, would be joined by a single line from the parent domain that crawled it. This way there wouldn't be too many confusing lines on the render yet you could still see how various domains were connected.
Layout
Once I had the idea how I was going to represent the data from the crawler it was then a matter of working out how to lay out the nodes. I knew that the nodes were going to be circles and I knew that I didn't want them to overlap, I also wanted a dynamic looking graph (like the one in Gephi video above).
To achieve this I decided to use Box2D the popular physics engine to take some of the difficulties with positioning away for me. Using Box2D each edge between the nodes is a distance joint and the nodes themselves are simple circle shapes. Then I just let the simulation run and the nodes move and naturally try to separate from each other.
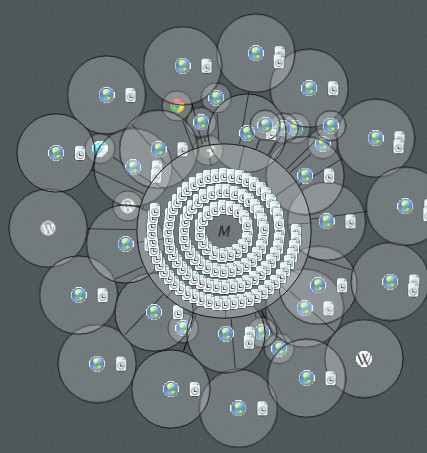
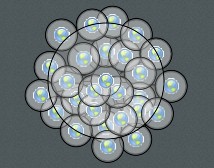
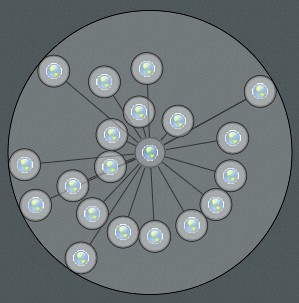
This solution worked in some situation however it was sub-optimal in others. The problem is that because each crawl is different you can end up in situations where there are many small nodes grouped about a parent or a few very large nodes:
I spent a good long while trying to ‘frig’ it so that the length of the distance joints between the nodes were right in most instances so that the nodes didn't overlap. The code was starting to look really messy and complex incorporating rules that depended on the number of children / siblings, the relative size of the nodes, the total length of the sibling nodes, the area values with proportion to the total area and so on.
No matter how many times I multiplied here, divided here I couldn't hack it into a form that worked for every crawl. So I decided to go back to the drawing board and rethink the layout problem.
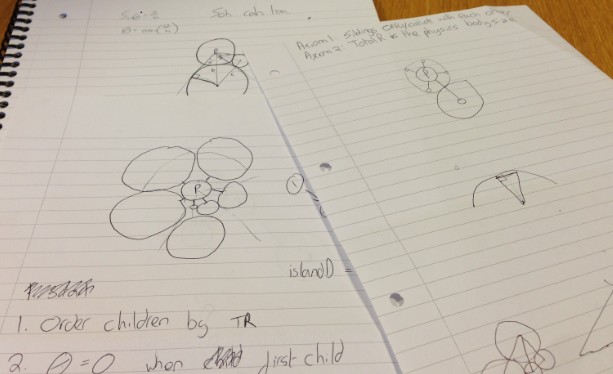
After some scribbling I decided that what I needed to calculate was the total amount of space required for a node and the amount of space its parent had to allocate to fit it. Once I could correctly calculate those two it should be a relatively simple matter of spacing child nodes correctly about their parent.
I also noted that each node’s required area is simply the recursive sum of the space required by its children:
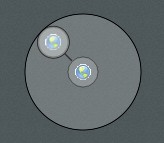
At the smallest scale the total space required by a single node is just its radius. If you add a child to that node then total space required is the nodes radius plus a constant distance plus the diameter of the child.
As you add more children however you run into the problem that there won't be enough space about the parent:
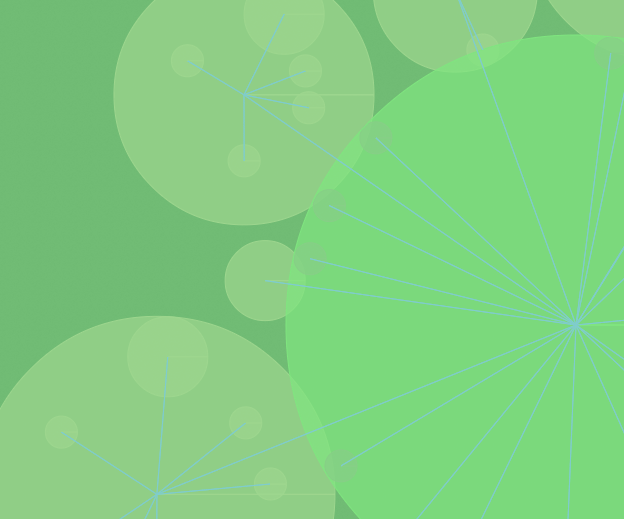
So now you must layer those children into concentric rings so that there is definitely enough space for each child. So how to do that. Well that was the tricky part and required some trigonometry (just about the only thing I remembered from high school maths).
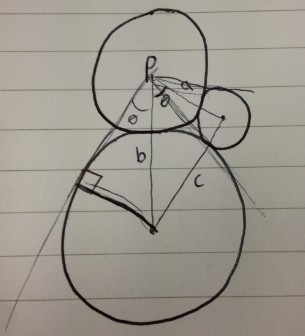
Because we know the distance between the centre of the child and its parent and we know the radius of the child we can calculate the angle between two lines that extend from the parent and lie on points on the outside of the child’s radius and are perpendicular to the child's centre.
When we have this angle its a simple matter of looping through all of the (sorted smallest to largest) children adding up the angle required until you reach the maximum 360 degrees. Then you increase the distance between the parent by the diameter of the last node and start again on the second layer of children. This way you can guarantee that every child will have sufficient space about the parent.
Rendering
I knew that the graph would get very large and would be complex to render so performance was critical. I didn't want to spend ages messing around with WebGL, having done some before I knew that potentially it could take a lot longer than the relatively simple canvas2d. Because Chrome has a hardware accelerated canvas2d I reasoned that the performance should be okay.
Unfortunately even on a decent machine, the rendering is still rather slow, so that you usually cant crawl beyond about a depth of 3. I tried all the common tips and tricks that can be found on the internet such as minimizing context switches when drawing lines and circles and caching commonly drawn things together in an image so that there are fewer draw calls. I even tried to assist chrome by putting the icons on one large image sheet, thinking it would be represented by a single texture behind the scenes thus minimise context switches when rendering to the GPU.
It seems however, that if you want performance in the browser you are going to have to go with WebGL.
Improvements
Given more time it would be nice to explore swapping out the 2d rendering pipeline with a purely 3d one using WebGL, that should increase the speed of things a great deal. One idea is I could use point-sprite particles to render each icon within a 3d graph with wireframe lines to represent the edges between the nodes.
I did some work on point sprite particles in WebGL a little while ago so I know it should be possible to render millions (literally) of nodes and edges that way.
Finally
Well thats the end of my series on the internals of Recursive, I hope you have enjoyed it. I haven't decided whether I want to release the source code just yet, I may return to the project in the future, but if you are interested in looking over the code send me an email: mike.cann@gmail.com